Follow us :

With the Page Experience algorithm update coming recently, Lab data and Field data have become among the most talked-about concepts in SEO communities. Let’s dive into the depths of our blog post, where we examine Lab data and Field data from simple to detailed.
What is Lab Data? What is the Value of SEO?
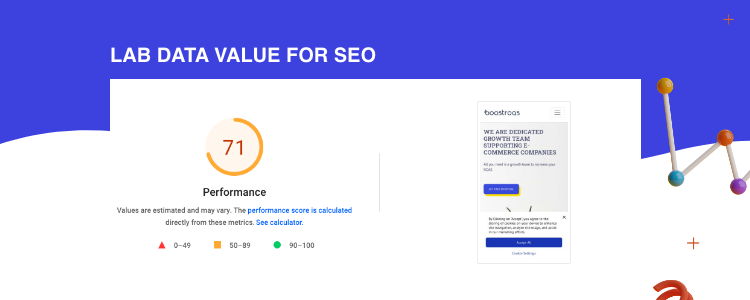
Lab data refers to the data obtained by testing tools such as Lighthouse, WebPageTest, SpeedCurve, or GTMetrix under certain conditions, that is, as the name suggests, in a laboratory environment. Due to the fact that these measurements are made by only one unit under certain circumstances, the metrics are different based on the device. Each tool has its scoring system, and by giving your site a score based on the general or metric result, you will be able to find out whether or not your site is performing well based on the lab data. In the example above, you can see the Lighthouse scoring system. Based on the measured performances of your page, you will receive the page’s overall score.
So what is the importance of lab data in terms of SEO? It has absolutely no value. Once upon a time, when only lab data was available in PageSpeed Insight, we tried to optimize our site speed according to these scores. Is there any harm in optimizing according to this score? It could be meaningful, but not the context in which Google refers.
Do SEO for users, not for search engines!
We see this magical phrase in every classic SEO blog post, right? In fact, Google thinks the same about page experience. That’s exactly how I see it. I explain the Lab data as follows; “Lab data is a means to an end.” So it doesn’t make sense on its own. If you try to optimize the Field data by interpreting it, this is precisely where it will affect SEO.
I would like to say the last word by sharing the tweet of John Mueller, who is the first name that comes to mind when SEO is mentioned, about Lab data.

What is Field Data? Why is it Important for SEO?

The field data actually comes from the data obtained with the Real User Monitoring (RUM) methodology. It includes the performance experiences of all users or selected samples that access your websites. In fact, it is an ideal measurement method for your website’s page experience or speed. Percentages are more critical here than scores like Lab data.
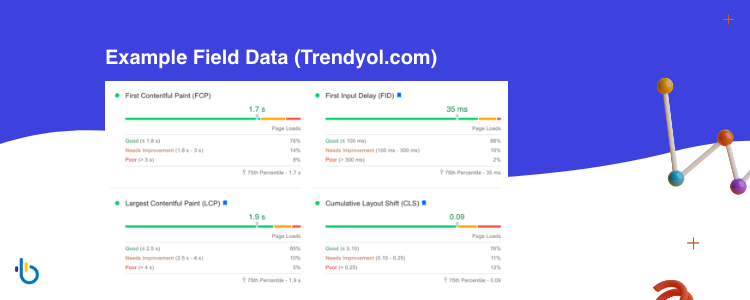
Let’s explain this with an example:
This website belongs to the homepage of Trendyol, one of Turkey’s largest e-commerce sites. For instance, when we look at the First Contentful Paint metric, it takes less than 1.8 seconds for paint to appear on the screen to have a good experience. When we analyzed our metric’s performance, 78% of mobile users (or selected samples) visited our site and had a good experience. So, before 1.8 seconds, the paint appeared on their screen. Likewise, 14% of mobile users experienced between 1.8 seconds and 3 seconds, and 8% of mobile users took more than 3 seconds and had a bad experience.
Why is Field Data More Important for SEO?
And again, as we mentioned initially, we need to do SEO for users, not Googlebot. Users are at the center of Field data.
Some Lab data may crawl your site from the nearest location or directly based on a country. This negatively affects your direct Time to First Byte metric. In the Field data, you do not have this problem. If your server is suitable for your target audience, your server response time will also perform well unless otherwise.
Or let’s say you have a general audience. There will be a breakdown of users with slow connections and high connection speeds among this audience. Accordingly, you need to adjust your website’s simplicity or visual strength and open it as fast as possible to provide a good experience.
There may be a problem with the phone version or model that the user uses that does not show up in the Lab data.
In short, the essence of Field data is to be “user-oriented.”
In Field Data, You Are A Sample Too

How does Google get the data of all websites?
By adding a script to all websites, it decides the page experience? Of course not. It has a data library like Chrome, and by making sense of the samples in this library, it fixes the overall page experience of the websites. Yes, you heard right. When you enter a website, you can open DevTools to look at the speed experience on that page. Google collects exactly this data and creates the Chrome User Experience report. How was your experience with the Time to First Byte metric on the page, or how exactly was your visual stabilization experience? Here, it collects the answers to these questions from users like you who use Chrome and aggregates the pages. Afterward, it creates the percentage of experience of the pages for desktop and mobile.
“The Chrome User Experience Report is powered by real user measurement of key user experience metrics across the public web, aggregated from users who have opted-in to syncing their browsing history, have not set up a Sync passphrase, and have usage statistic reporting enabled.”
– Source: https://developers.google.com/web/tools/chrome-user-experience-report
In short, Chrome User Experience (CrUX) is a report that focuses on the user experience, including the Real User Monitoring page experience of only Chrome users.
Well, I’m using Safari. I also use Firefox on mobile. Does my experience affect this report? It doesn’t affect; would suggest you download Chrome.
Where Does the Chrome User Experience Report Appear?
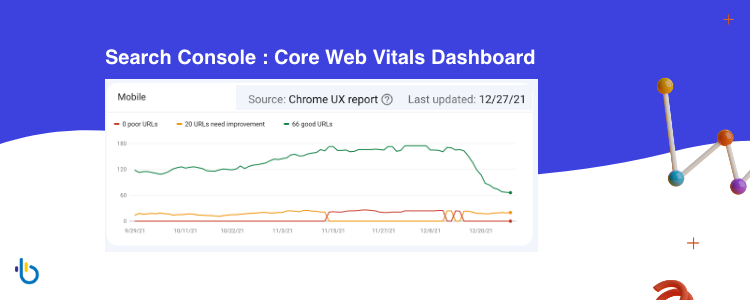
When we open our Search Console property, the page experience dashboard and Core Web Vitals dashboard consist entirely of the output of Chrome User Experience reports. In 28 days, the data of our users is collected, and their metric performance changes. By looking at the date of the last update, you can find out when the report was last updated.
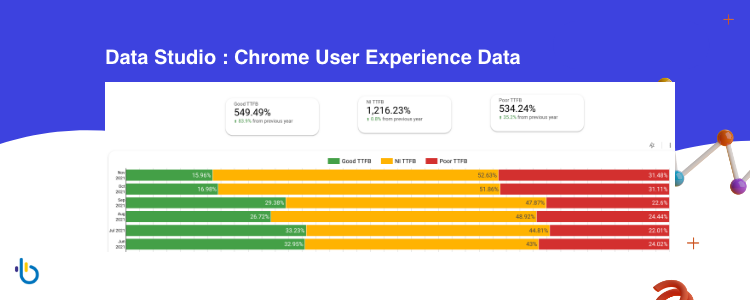
Another part where we can use the Chrome User Experience report is the Data Studio dashboards. If we have charts on Data Studio where we monitor our organic performance, we should separate them into Chrome User Experience reports as a separate page. Through these reports, we should be able to intervene in order not to decrease our organic performance and conversion rate in the event of a possible bad situation by constantly examining the page experience of our users.
How Can We Use Chrome User Experience Report More Effectively in Data Studio?
Unfortunately, when we add the URL in the Chrome User Experience report, it does not give the metric performances of all our website pages. So here, we need to edit the Chrome User Experience data as manually as possible.
My working style here is as follows. If you are an e-commerce page, let your samples be the pages that get the most traffic, in other words, the pages that accumulate the most data. Then, create sections for Time to First Byte, First Contentful Paint, Largest Contentful Paint, First Input Delay, and Cumulative Layout Shift metrics, one under the other.
For example, create a graphic area for your pages with different layouts for the First Contentful Paint metric in each section. E.g., Main page, category page, product page, a page with a blog post; if there are other types of pages, add them; in fact, add one from each page with different layouts in general. You can make available performance evaluations by assuming that pages with similar layouts will have the same metric performance.
How Can We Make Sense of the Chrome User Experience Report?
Field data should not be interpreted as Lab data. The Lab data provides a metric result directly, whereas the field data provide an average time. The main factor we should pay attention to is the percentage of users with experience.
For example, a score under 0.1 on the cumulative layout shift metric is a good and reasonable result. Scores between 0.1 and 0.25 indicate a situation that should be improved. Above 0.25 suggests that the experience was poor.
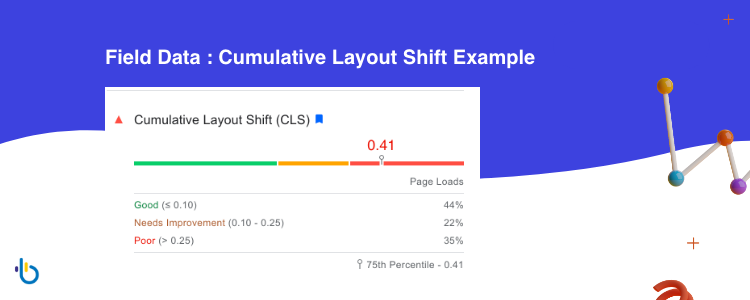
This is where percentages come into play. As in the example, 44% of our users in the sample have provided a good experience. So they loaded the page with a score under 0.1. 22% of users loaded the page with a score between 0.1 and 0.25. On the other hand, 35% experienced a score above 0.25, which is a pretty bad visual stabilization experience. So rather than an average result, percentages of experiences are more important in this area.
If you want to get more detailed information about Cumulative Layout Shift, you can take a look at the guide I wrote about it.
In the Field data, how is metric performance defined as good, improved, or bad? Here, the principle of “The 75th percentile score” takes the stage. So if 75% of your users are getting a good experience, your performance on this metric will be good. If 74% of your users have a good experience and 1% is need improvement, your performance on this metric will need improvement, or in other words, it will be in amber. If 73% have a good experience, 1% need improvement, and 26% have a poor experience, our metric will be red. That is, it will appear poor. So the experience percentage of 75% complete makes your metric good, need improvement, or poor.
When Is My Optimization Reflected In The Chrome User Experience Report?
You looked at user data and did a technical optimization to improve a metric that got poor results from your pages. Will this change be reflected in the report immediately? Our 28-day rule starts right here.
The 28-day period here actually varies. The traffic your page receives is also essential here, in a way. The performance here may change beforehand because of the increasing number of samples.
How Can I See Field Data in Real-Time?
Analyze Your Real-Time Core Web Vitals Metrics Using Google Analytics 4 and BigQuery
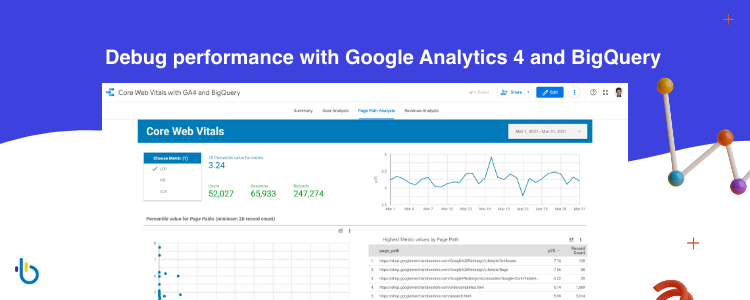
We mentioned that the Field data is 28 days in the Chrome User Experience report. As you know, speed optimizations are operations where a little more trial and error is adequate, so we may want to see the results instantly. It is also quite logical to use Lab data for this. But there are different ways to see Field data in real-time.
The first and most effective way to do this is, of course, to use Google resources. But for this, you need to have a Google Analytics 4 property and also a BigQuery project. You need to enable BigQuery export in Google Analytics. After that, you can start collecting data by adding the web-vitals Javascript library to your website. You can customize your data using SQL language, pass queries and get information. Thus, you can access the performance of your Core Web Vitals metrics in real-time and measure the impact of the changes you make on the user experience.
Use Third-Party Real User Monitoring
If you cannot use two essential tools such as Google Analytics 4 and BigQuery, you can use Real User Monitoring tools as an alternative. In addition, these RUM tools will be getting the experience of not only Chrome but also all other browsers. If you still want to improve the Chrome User Experience report, you can filter the Chrome browser to optimize accordingly.
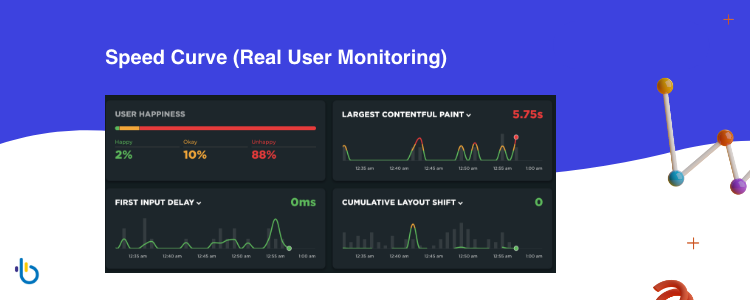
I will tell you a little about the Speed Curve tool I use and have experience with before. We first need to do it straightforwardly; we embed the script given to us by the Speed Curve tool on our website. Afterward, we can watch our users’ experiences live from the RUM section on Speed Curve.
Which metrics of users can we measure through the tool?
- Backend (TTFB) you can also check these metrics one by one in detail Server Response Time, SSL Negotiation, DNS Lookup, TCP Connect, Start Render
- Front End, First Contentful Paint, Largest Contentful Paint, Page Load, DOM Interactive, DOM Content Loaded
- To measure interaction speed; First Input Delay, Interaction Time, Click Interaction Time, Key Interaction Time, Scroll Interaction Time.
- For blocking time measurement; JS Long Task, JS Longest Task, First CPU Idle
- Also, Cumulative Layout Shift for visual stabilization.

Which criteria can we filter our users who log in via the tool?
- On which pages and how did they experience it?
- What country are they connecting from? GEO Location.
- What device and browser are they using?
- What about users’ connection speed? Connection Type
- How much memory is the device they are using?
- Viewport details of the device they are using
As I mentioned above, we can monitor users’ data with a third-party tool. Thus, by processing this data, we can identify the problem improve our Core Web Vitals metrics and increase our potential traffic with a good page experience in our current category.
Some Disadvantages of Field Data That Affect Our Performance Negatively
We agree that Field data is more effective and reflects reality than Lab data. Also, we agree that it is more user-oriented since it measures the experience of our target audience. No problems so far.
But there are some extreme situations. For example, let’s say we are a magazine website serving the United States. However, since our topics are general, we will not be getting only USA-oriented traffic. We may be getting traffic from the UK, Australia, or India, where English is widely spoken. They may even be taking up too much space among user samples. So we have to make sure that the CDN we use is quite global.
We should not be serving only one location on the server-side. This is essential if we want good server response time and overall good Time to First Byte performance in these locations. You may even have to make extra developments to these markets.

If we take into account the use of the Safari browser, which uses the iPhone on the mobile side in the United States, let’s assume that we get traffic from the market where Android devices are more popular and connected from a different market. Some sources say that more than 55% of US devices use iOS. [1] In India, this rate is 95% android. [2] Of course, the economic model of the markets we receive traffic or users’ purchasing behavior differs. This aspect of marketing also affects us here.
Conclusions
Although Field data has disadvantages in many cases, it is more important because it is user-oriented and directly measures our target audience. Lab data is of no importance for SEO, as it varies for each vehicle and has different measurement methods.
If you want to increase your impact on Google search results, your first focus will be on the percentages of your pages’ domain data in the Chrome User Experience report. Increasing your Lighthouse score from 40 to 60 or increasing your GTMetrix score from C to A will not help your visibility in search results.
We can boost the Search Console > Search Appearance > Good Page Experience graph by analyzing our users more and grappling with data.


