Highly Personalized Retargeting Campaigns
Google Analytics provides a ton of information revolving around the customers’ online engagement but more broadly doesn’t know about anything that happens between the online customer engagement and the offline customer data. To gain full visibility of the journey and sales cycle, we combined the online – and offline user engagement data. In turn, this allows us to make highly personalized retargeting campaigns.
The Power of User Segmentation
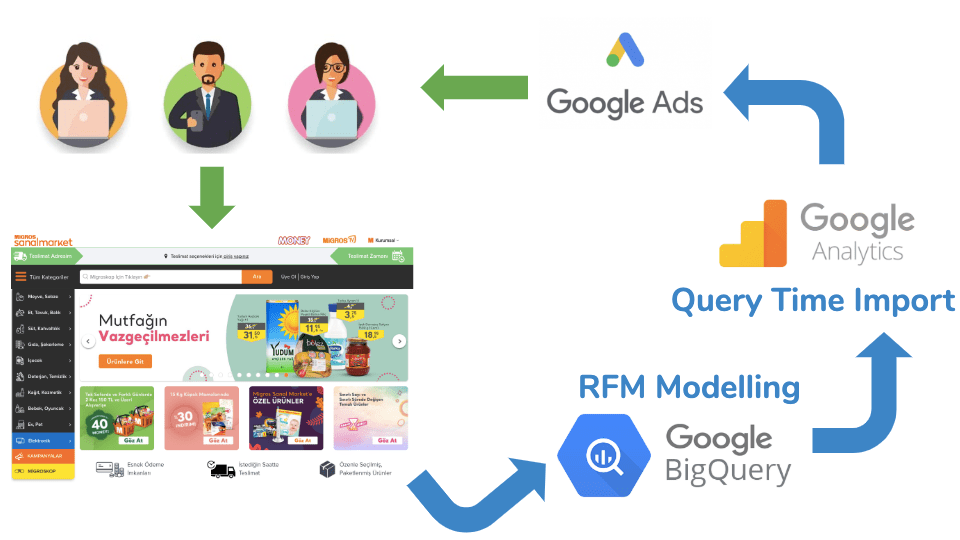
Google Analytics 360 lets us to merging marketing and CRM data for more extensive CRM analysis. It has pushed segmented data to Google Analytics by using Google Analytics query time import mode via Google Analytics management API. That allows us to target by RFM scores on Google ads. Also, we linked third-party data through BigQuery.
We set five primary users segmentation to marketing touch-points along the entire customer journey as new users, registered users, first buyer, segmented users and churn users to focus every unique customer. We optimize each touchpoint on costumers’ moments to generating more revenue and active users.
Then we set the different marketing KPIs for each of the segmented users, by targeting the ended last-click focus we ensure converting these into the micro-conversions such as new user registration rate, first-order rate, or churn rate. This segmentation allows to syncing of CRM, and GA data, that empowers finely segmented and highly personalized retargeting campaigns.
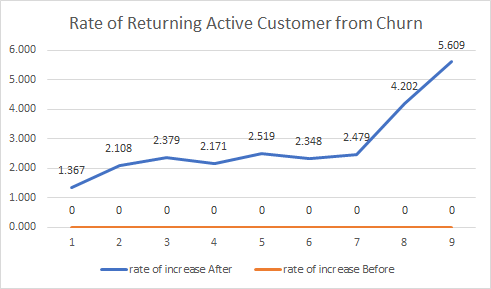
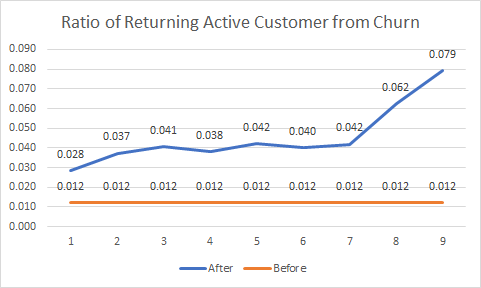
Deeply CRM Integration Helps Reconnect with Churn Customers
After four months the results are;
– %57 of the user was churned, and the Google ads campaigns didn’t uncover these audiences. After we started to target churn users, the churn sales increased to 4x.
– To grow-up to active buyers, one of the critical KPIs is to increase the first-order rate that increased 6x.
– As a consequence of deeply CRM integration, overall sales performance shot up by %39.
Data Science Behind The Success
Statistical Reinterpretation of RFM Model
The generally known RFM model (R: Recency, F: Frequency and M: Monetary) was calculated by taking a different approach by dividing it into R, F and M components. The aim of this approach was to unravel the customer’s behavior pattern in the grocery retail sector more robustly than the algorithm in the RFM model. While the recency value is concerned with when the customer made the final order in the classic RFM model, in our approach we valued the R considering when the customer may have been churn which is depend on shopping periodicity.
Definition of Churn
The fact that we separated the R part from the classic RFM model gave us information on when the customers were going to be Churn, and whether or not they threw away the products with an expiry date close to their baskets.
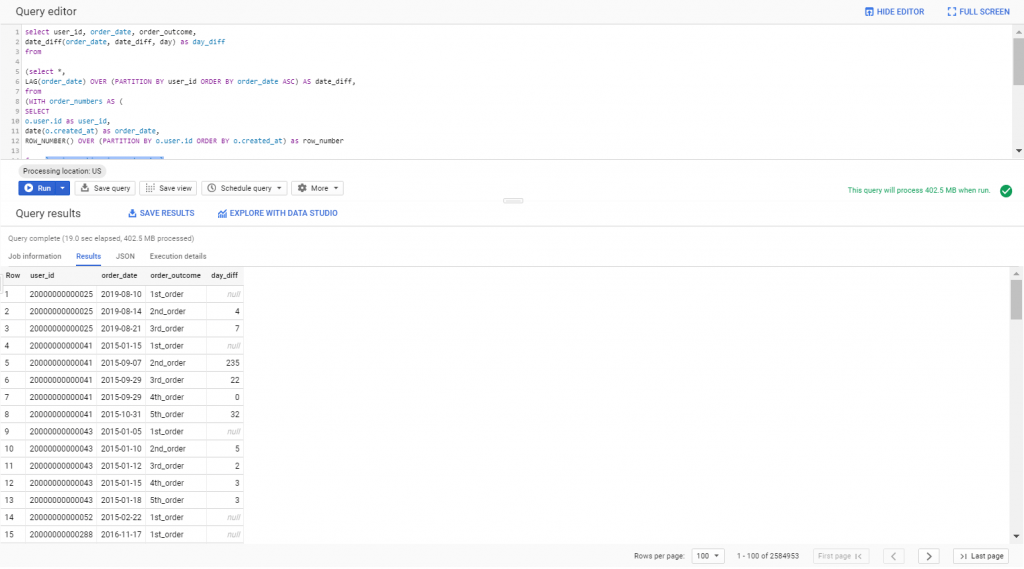
The churn algorithm is mainly focused on customer specific shopping habits and periodicity. Using Robust M-estimators, the mean and standard deviations of day difference between orders vectors are calculated on a customer basis as well as which statistical distribution corresponds to the customer’s order. Then, using this vector mean and standard deviation, it is estimated as a statistical confidence interval with 95% confidence that the customer will order within days from the last order date. Churn date is the upper limit of this calculated statistical confidence interval.
If the customer has not placed an order on the expected date of the order, this means that the customer has not yet placed an order on the date of the churn, so that the customer receives the “churn prospect” label. If the standard deviation of the day differences between the two orders mentioned above is less than the standard deviation of all customers, then these customers are labeled as periodic customers.
The result of this operation calculated in the SQL query, whether each customer is periodic, how many days he ordered, and the standard deviation, whether the customer is a churn prospect, and the estimated date of the churn, will take place in the user_attributes table created in the big query. According to the additional product based order analyzes, it is also observed that periodic customers received more products with less expiry date than non-periodic customers. In the light of this insight , product focused retargeting campaigns is also reshaped.
Customer Segmentation: Simple But Robust
Other components of the RFM model F and M were used in segment analysis. The main purpose of segment analysis is to group customers according to their order amount and the number of purchases they make within a certain period of time. This analysis seems to be at the level that can be done by four simple operations, it is very important to separate the segments from each other with sharp boundaries. Because if you do not distinguish between customers with sharp limits, the variance within the group grows, which means that you cannot make a statistically good classification. This means that over time, you don’t understand which customer is truly royal and which customer is a promising customer.
By using Robust Huber measure, first, customers are divided into 4 segments. Group A with high turnover and order frequency, Group B with frequent turnovers but low turnover, Group C with low turnover and order number and Group D with low turnover. The group C is then divided into the C- group, which is formed by only one order. Similarly, in the A group where the most valuable customers are found, a statistically significant difference has been found between the first 5% of the turnover and the first 5% -10% of the turnover and the A group is the most valuable to the valued, respectively, A ++, A + and A were divided into 3 groups.
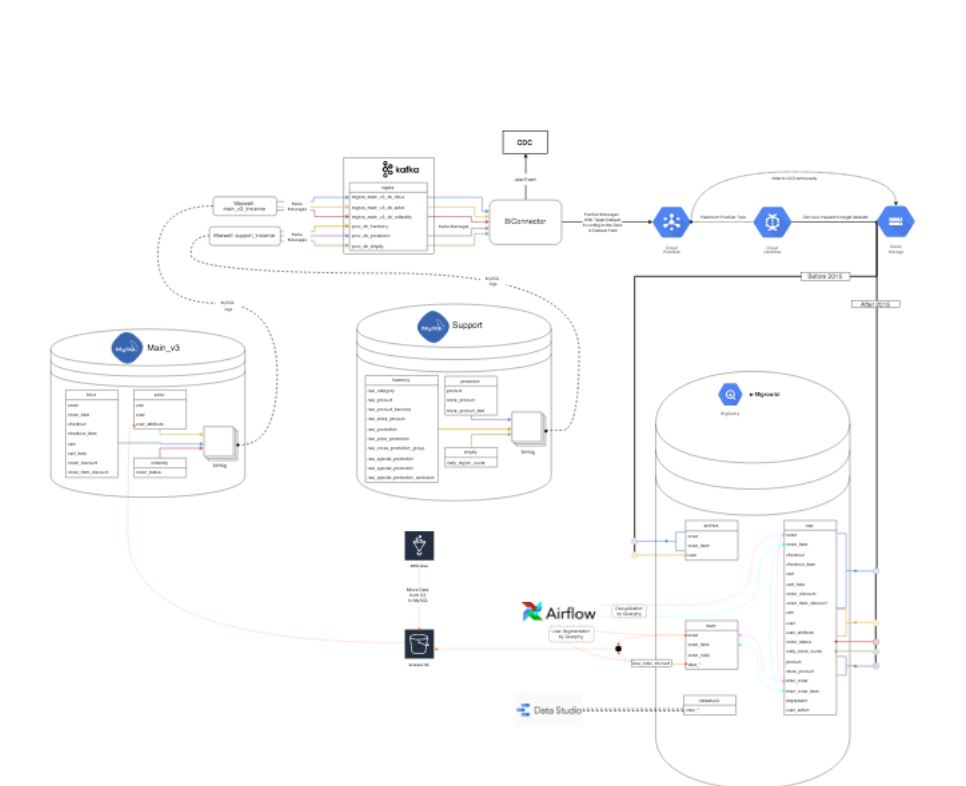
Deployment of the Implementation
In order to use the aforementioned statistical analyzes, we needed a user-friendly, fast and advanced technology environment where we could both import data which does not contain any PI into Google Analytics and easily analyze this big data. BigQuery solved all these problems.
How Did We Do That?
More than 100 variables and everything related to the previous order processed in CRM logic from our client main database to the user_attributes table in BigQuery. This information is then used in the second SQL query to calculate churn, periodicity and segments, and this query is executed and updated every morning with the bilk order SQL query with the help of various jobs. The updated user_attributes are migrated to Google Analytic by updating the corresponding table in our client’s main database.